For beginners, understanding stock charts can seem intimidating. However, learning to read them is essential for making smart investment decisions. Stock charts visually represent price movements and trends, helping you identify opportunities and risks. In this guide, we’ll cover how to read stock charts in India, explain basic concepts like candlesticks, support/resistance levels, and trends—all in a simple way for beginners.
By the end of this guide, you’ll be able to interpret charts confidently, helping you make informed investment decisions in 2026 and beyond.
1. What is a Stock Chart?
A stock chart is a visual representation of a stock’s price movement over time. It helps investors track performance, identify patterns, and make decisions.
Types of Stock Charts:
- Line Chart: Shows closing prices over time. Simple and easy for beginners.
- Bar Chart: Displays open, high, low, and close prices for each time period.
- Candlestick Chart: Most popular among investors; shows price movements using “candlesticks” with body and wicks.
Tip: Start with line charts if you’re a beginner, then move to candlestick charts as you gain experience.
2. Understanding Candlestick Charts
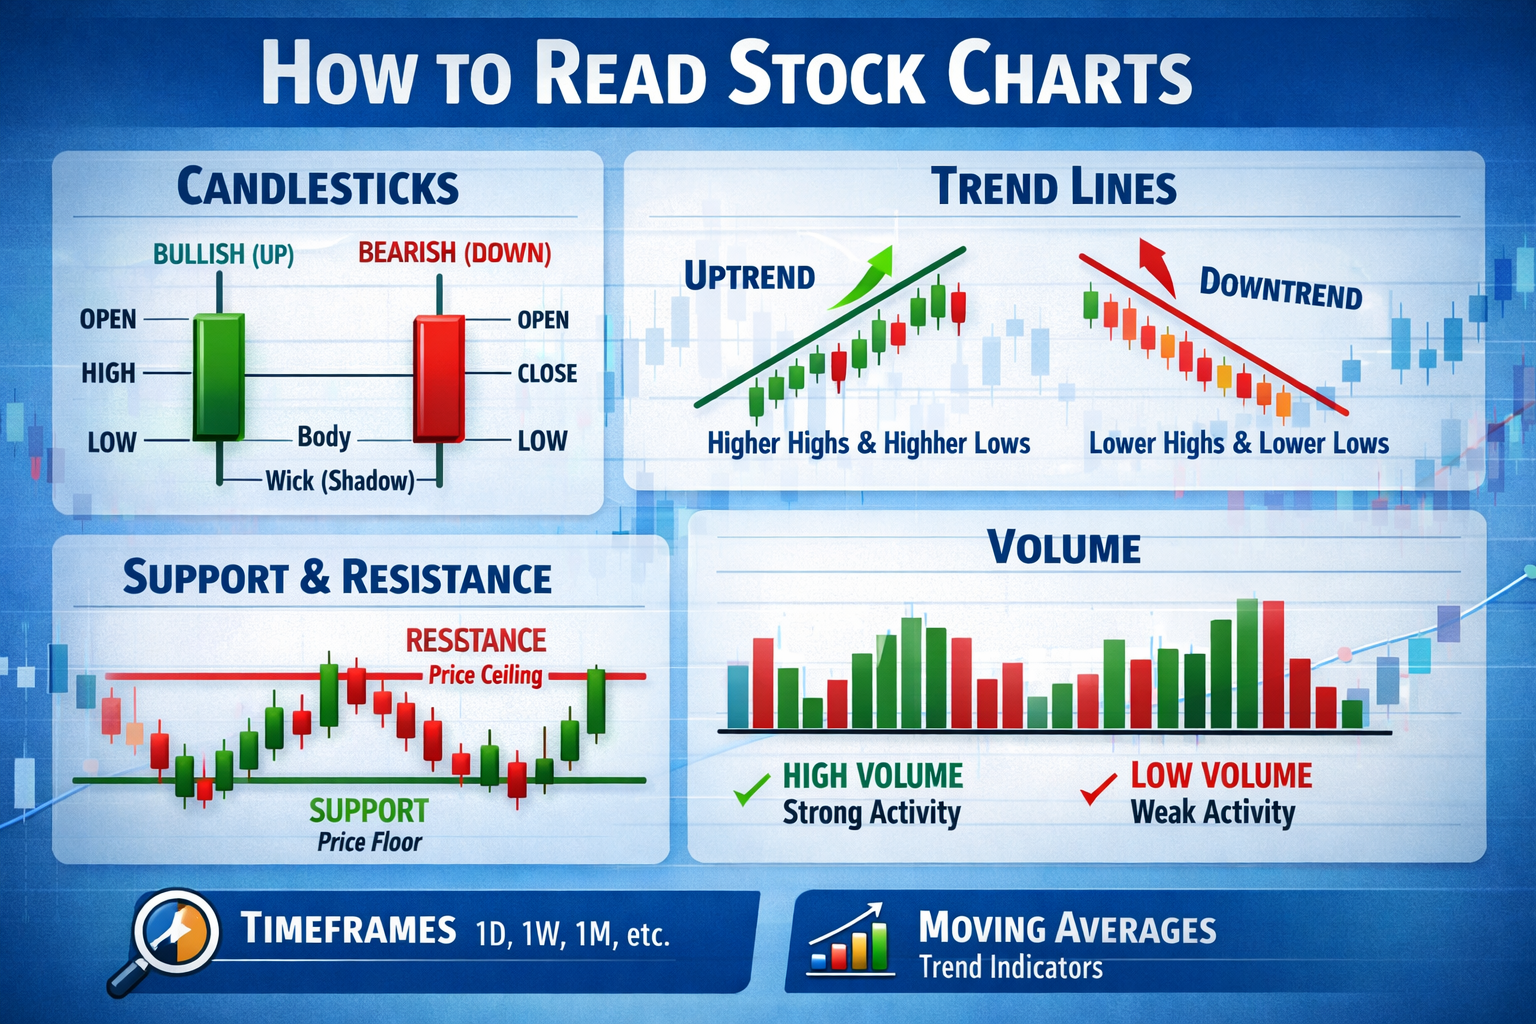
Candlestick charts are widely used in stock analysis. Each candlestick represents a time period (e.g., 1 day) and shows:
- Open Price: Price at which the stock started trading for the period
- Close Price: Price at which the stock ended trading for the period
- High Price: Highest price during the period
- Low Price: Lowest price during the period
Color Coding:
- Green / White Candlestick: Closing price higher than opening price → bullish (price went up)
- Red / Black Candlestick: Closing price lower than opening price → bearish (price went down)
3. Identifying Trends
Trends show the overall direction of a stock price. There are three main types:
- Uptrend: Higher highs and higher lows → stock price is rising
- Downtrend: Lower highs and lower lows → stock price is falling
- Sideways / Consolidation: Price moves in a range → no clear direction
Tip: Investing in an uptrend is generally safer for beginners.
4. Support and Resistance Levels
- Support: Price level where stock tends to stop falling → demand increases
- Resistance: Price level where stock tends to stop rising → selling pressure increases
Why Important:
- Helps identify entry points (buy near support)
- Helps identify exit points (sell near resistance)
Example: If Reliance stock finds support at ₹2,500 and resistance at ₹2,700, you may consider buying near ₹2,500 and selling near ₹2,700.
5. Basic Patterns to Watch
- Double Top / Double Bottom: Signals trend reversal
- Head and Shoulders: Predicts trend changes
- Triangles / Flags: Indicates continuation or breakout
Pro Tip: Beginners should focus on trend and support/resistance first before diving into complex patterns.
6. Using Volume to Confirm Trends
Volume represents the number of shares traded in a period.
- High Volume: Confirms trend strength
- Low Volume: Trend may be weak or unreliable
Example: If stock breaks resistance with high volume → strong bullish signal
7. Free Tools to Read Stock Charts in India
- Moneycontrol – Free charts with technical indicators
- NSE India – Official exchange charts, reliable
- TradingView (Free Version) – Interactive charts, beginner-friendly
- Yahoo Finance – Simple charts, daily updates
Tip: Start with Moneycontrol or NSE India charts for simplicity.
8. Tips for Beginners While Reading Charts
- Don’t rely on one chart alone; check multiple timeframes
- Combine charts with fundamental research → company performance matters
- Avoid overanalyzing patterns → stick to basics first
- Practice with virtual portfolios before investing real money
Conclusion
Learning to read stock charts is a powerful skill for every investor. While it may seem complex at first, starting with candlestick basics, trends, and support/resistance levels will give you confidence to make smarter decisions.
Remember: charts show trends and probabilities, not guarantees. Combine chart reading with research, patience, and consistency for long-term success in the share market.
Call-to-Action (CTA)
Ready to master the stock market? Subscribe to our newsletter for weekly tips, chart analysis, and beginner-friendly guides. Start your journey to smart investing today!